
BI & Analytical products
BI Tool

ElegantJ BI Feature
The ElegantJ BI provides a self-serve, mobile business intelligence suite that is suitable for every size enterprise, business function and business user. ElegantJ BI is not just a visualization tool but it provides actionable insights for a quick decision making with enhanced business intelligence and analytics. Our BI suite provides various tools and sophisticated features and functionality in an easy-to-use environment that will help your organization transform business users into Citizen Data Scientists.
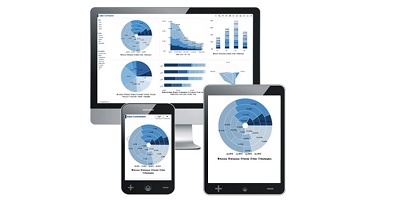
Personalized Dashboards
Monitoring, Analyzing, Presenting! ElegantJ BI dashboards are 100% browser based, with a unique ‘Design once, Use anywhere’ UI engine that ensures a seamless user experience across desktops, tablets and mobile devices. Business users can design personalized dashboards in minutes, without knowledge of any programming or SQL queries. Users enjoy stunning visualizations, alerts for exceptions and trends, and deep dive analysis using highly interactive ElegantJ BI dashboards.
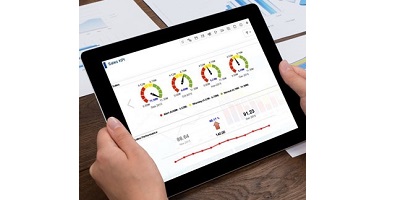
Multidimensional Key Performance Indicators (KPIs)
KPI Analytics. The New Way Forward! Users can define KPI with an easy to use, powerful expression engine and set polarity, frequency, and threshold levels using a browser based interface. Users can establish and monitor KPIs at the individual, team, department, division and company level. Defined KPIs are not limited itself to static monitoring. KPI Analytics provide interactive options to change frequencies, dimension break downs and drill down to further analyze trends, and reasons for performance and non performance.
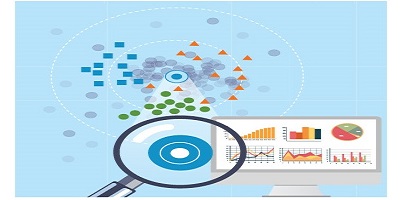
Advanced Data Discovery
Transform Business Users into Citizen Data Scientists! Advanced Data Discovery lets business users perform early prototyping and test hypotheses and ensures data democratization with Self Serve Data Preparation, smart visualization and plug n’ play predictive analytics that transform business users into Citizen Data Scientists. Self-Serve Data Preparation allows business users to connect, join and manipulate data with smart suggestions on relationships, and hierarchies, and offers tools to improve the quality of data. Smart Data Visualization suggests the best visualization to display underlying data for the most meaningful visualization.

Deep Dive Analytics
Visual Analytics, Monitors. Deep Dive, Discovers! Cross-tab analytics offers a 360 degree view of your multi-dimensional data with ad-hoc queries and BI reporting so you can take full advantage of Business Intelligence with a clear view of corporate performance and ability to slice and dice data, drill down, drill up and drill through to find the most relevant Information. It also provides easy-to-use complex data operations, summary operations, time series functions, filters and custom column expressions engine to help users make prompt, effective business decisions.

Plug n’ Play Predictive & Forecasting Analytics
Create Citizen Data Scientists To be successful in business, every organization must find a way to accurately forecast and predict the future of its market, and its internal operations, and better understand the buying behavior of its customers and prospects.
so users who are not statisticians or predictive algorithm experts, can leverage self-service plug n’ play predictive tools to confidently make business decisions.
What-If Analysis
Analyze Scenarios, Plan Better

What If Analysis allows users to see the impact of a prospective change to a product, service, resource allocation, budget, project schedule, pricing, raw material cost, labor cost, or other factors and compare that change to other options to ensure they have considered the impact resulting from each option. Users can select the appropriate option and compare results to plan for long-term and short-term strategies for necessary resources, training, funding and competitive response and achieve meaningful and confident planning across the organization.
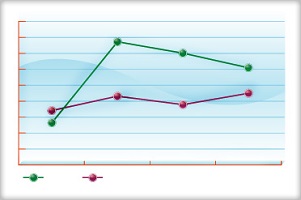
Graphical Analysis
More Than What You Can Graph! ElegantJ BI dashboards are 100% browser based, with a unique ‘Design once, Use anywhere’ UI engine that ensures a seamless user experience across desktops, tablets and mobile devices. Business users can design personalized dashboards in minutes, without knowledge of any programming or SQL queries.
Users enjoy stunning visualizations, alerts for exceptions and trends, and deep dive analysis using highly interactive ElegantJ BI dashboards. Avoid ‘Static Packaged Dashboards’ and user frustration with real self-serve dashboards and deep dive capabilities!

Exceptions and Personalized Alerts
Management by Exception Exception reporting allows users to define threshold points and monitor Key Performance Indicators and metrics, and receive alerts to notify them when exception conditions occur. Users have the ability to set, modify and delete alerts based on specific thresholds. Personalized Alerts notify users when something critical occurs, thereby enabling management by exception and relieving users of the need to continuously monitor results or produce reports in hopes of finding a problem before it negatively impacts the business.

Real Time and Cached Cube Management
It’s Not Rocket Science, Anymore! ElegantJ BI offers flexible options for data access and management so you can choose the option that is best for your use case scenario. You can connect to data sources like databases, OLAP cubes and spread sheets using simple wizard based connection interface in ElegantJ BI
Real-time cube management delivers analytics when real-time data is critical, so organizations can compete in a rapidly changing market.

Balanced Scorecards
Align Your Perspectives, Objectives and Measures The Balanced Scorecard is at the heart of the ElegantJ BI Corporate Performance Management solution. Balanced Scorecards include strategy maps, perspectives, objectives and measures and metrics all designed to present a holistic view of performance at every level of the organization
Users can plan and measure performance across Finance, Customers, Internal Processes, and Learning & Growth perspectives. Achieve your vision and align your strategy across teams with a simple to use, 100% browser based interface that is suitable for every user and level in your organization – from the highest level strategy, to tactical and operational levels.

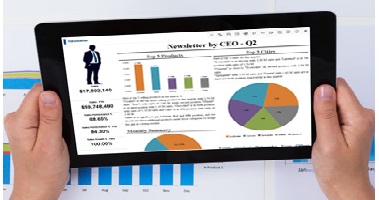
Intuitive Reporting
Simple to Create. Ready to Publish! ElegantJ BI Reports delivers your web-based BI reports to anyone (or everyone) in your organization within minutes! ElegantJ BI is simple to use, practical to implement and affordable for every organization.
With BI reporting, Users point-and-click and drag-and-drop and you can instantly create a report to summarize your performance metrics, or operational data, all in a self-serve environment without programming or database or SQL skills. Produce meaningful, personalized reports with ease and simplicity. Users can automate publication and delivery of these reports via email, thereby improving productivity and ensuring that information reaches the right people at the right time.

Publishing and Delivery Agent
Any Information, Any Format, Anywhere! The ElegantJ BI publishing and delivery agent is designed to meet every need and to ensure that every business user has the Information they need. BI objects such as dashboards, reports, cross-tab or graphs are automatically delivered via email or file publishing so users stay abreast of issues, opportunities, financials, sales and other metrics.
Publishing and Delivery Agent provides a flexible and intelligent information delivery mechanism, with complete, fine grained security and access provisions, to ensure that the user receives up-to-date, clear information when they need, and in the format they specify, via the channel they prefer.
Choose the Best Option For YOU – Real-time or Cached

Conquer Time and Manage Opportunities, Issues, Trends, and Patterns! Choose the option that is best for your use case scenario. Real-time cube management to deliver real time analytics when real-time data is critical, and Cached cube management for high performance analytics on pre-aggregated data.
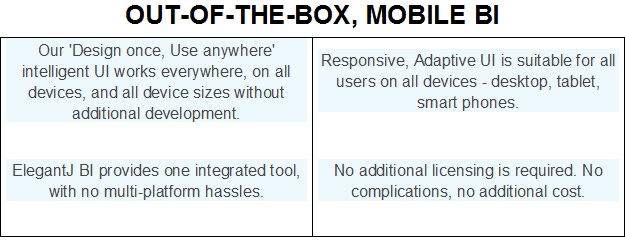
Out-of-the-Box, Mobile BI with a 'Design Once, Use Anywhere' UI Engine
Mobile Business Intelligence
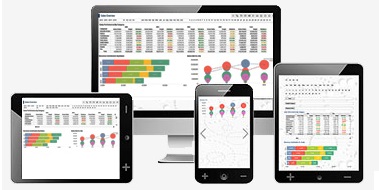
We don’t just talk about mobile business intelligence, we deliver it! We don’t dictate the device, the screen size or the setting in which you access your critical business intelligence data. We simplify the process with our 'Design Once, Use Anywhere' approach. The ElegantJ BI business intelligence UI is not just responsive, but also provides intelligent adaptive UI too, so it is ready-to-use on any device, any screen size, at any time and in any place with seamless performance.
Why accept restrictive, cumbersome business intelligence solutions when your business users can enjoy the ease of a high-performance BI tool that will work on any size or type of device. Empower your users with integrated business intelligence tools that provide access to data in an interactive, personalized view and enable data sharing, identification of trends and patterns and user empowerment and accountability.
In the past, BI tools were difficult to use and limited or restricted to access within the office or by certain individuals in the organization. ElegantJ BI is designed for today's fast-paced, demanding business environment, and supports your users in the office and on the road. Our BI tools are ready to use, out of the box without restrictive licensing.
ElegantJ BI in the Office and On the Go!
Desktop, Tablet, or Smart Phone
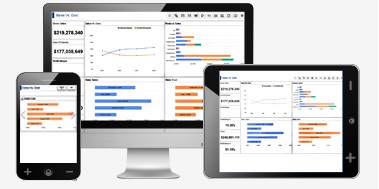
ElegantJ BI supports business users with seamless, mobile BI and allows the enterprise to provide self-serve BI tools without redesign or restructure of dashboards for specific devices and screen sizes.
Performance to Support Current and Future Data and User Volume
'Design Once, Use Anywhere' UI engine ensures that the organization can save time and money and roll out mobile BI to satisfy current and future mobile BI needs without additional licensing or development costs.
Integrated Data for One-Stop
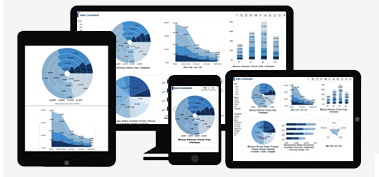
Business Intelligence Out-of-the-Box mobile BI tools support business users and the organization with personalized dashboards and reporting, elegant graphs and charts, and key performance indicators (KPIs) that display seamlessly on every type and size of device.
ElegantJ BI self-serve business intelligence is truly mobile, and features responsive, adaptive UI performance to accommodate use in a desktop, tablet or smart phone environment!
Not just in-memory processing anymore
There comes a time when a technology changes and disrupts the prevailing accommodative calm.
In Business Intelligence, it has been accepted that with expanding usage, in terms of the number of users or the increased application of Business Intelligence, the need for additional hardware will be high. Along with the cost of more licenses, the hardware needs to expand also, so the increase in cost is multifold.
This increase in cost limits the possibilities one explores for Business Intelligence.
Managed Memory Computing allows administrators to quickly and easily allocate hardware memory, based on criticality of data analytics and hardware availability, so you can avoid the cost of additional hardware and satisfy data and information processing needs for users across the organization.
ElegantJ BI puts the power in your hands

Power of Managing memory allocation
Optimize memory with application and priority of BI analytics, rather than number of users.

Power of Choice
Choose which data should be used in memory, based on priority and application of BI analytics

Power of having More
Expand BI usage without increasing cost of hardware, without changing the hardware

Power-Speed
Aggregated data in memory for amazing performance.
Deep Dive Analytics
Analyze data for any time period and compare ad hoc time periods. No limits on how you use date and time. Monitoring dashboards are usually limited to two to three predefined options for a time series.
Monitoring dashboards cannot bring in new data. For example, while analyzing sales, you cannot add information from finance or inventory, but Deep Dive analysis makes this possible.
Deep Dive analysis allows you to make cross tabs with filters and data operations, allowing you to ask any questions on the fly to make decisions.
Monitoring and Visual Analytics have predefined dimensions. Your queries and analysis are limited to these. Deep Dive Analytics, however, allows you to choose dimensions and measures for analysis on fly.
Filtering, sorting, and manipulating data is predefined in a monitoring dashboard. In Deep Dive analytics, you can do this on your own based on the problem you are trying to solve.Many filters on unlimited dimensions. Drill into the data the way you want.
Add columns, compare disconnected time periods, add columns with computed data, rank, filter, sort, change data operations, change summary operations and groups, and much more — the way you want.
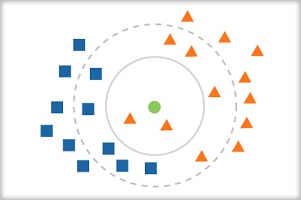
Plug n’ Play Predictive Analysis
To be successful in business, every organization must find a way to accurately forecast and predict the future of its market, and its internal operations, and better understand the buying behavior of its customers and prospects. ElegantJ BI plug n’ play predictive and forecasting tools help businesses to create Citizen Data Scientists by enabling the average business user to leverage sophisticated predictive algorithms without the expertise and skill of a trained data scientist, so users who are not statisticians or predictive algorithm experts, can leverage self-service plug n’ play predictive tools to confidently make business decisions.
Discover the Many Applications of Plug n’ Play Predictive Analysis

Featured Highlights of ElegantJ BI Plug n’ Play Predictive Analysis Tools

Time Series Forecasting predicts future values with simple, naive and weighted averaging, simple, centered, double and weighted moving averages and more!
Causation and Prediction Algorithms including simple linear, least square and multiple linear regressions.
Classification and Prediction including naive Bayes classification, associative, decision tree and K-Nearest Neighbour techniques.